
Levels of Nitrogen Dioxide (NO2) pollution in the air
What is the Indicator?
Annual average levels of nitrogen dioxide (NO2) pollution exposure measured in μg/m3 (micrograms of gaseous pollutant per cubic meter of ambient air). Figures are calculated by modelling annual average concentrations, calibrated against national monitoring data, of nitrogen dioxide.
A value is assigned to each residential dwelling (based on its square kilometre), and these are averaged across each census output area (geographic unit comprising around 150 properties). Average NO2 concentrations for higher geographies are calculated by taking a population weighted average over the constituent census output areas.
この指標について
年間平均の二酸化窒素(NO2)汚染暴露レベルは、μg/m3(環境空気1立方メートルあたりのガス状汚染物質のマイクログラム)で測定されます。数値は年間平均濃度をモデル化し、二酸化窒素の国家監視データに基づいて校正されています。
住宅ごとに値が割り当てられ(平方キロメートル単位)、これらは各国勢調査出力エリア(約150物件で構成される地理単位)にわたって平均されます。より高い地理単位の平均NO2濃度は、構成する国勢調査出力エリア全体の人口加重平均を取ることで計算されます。
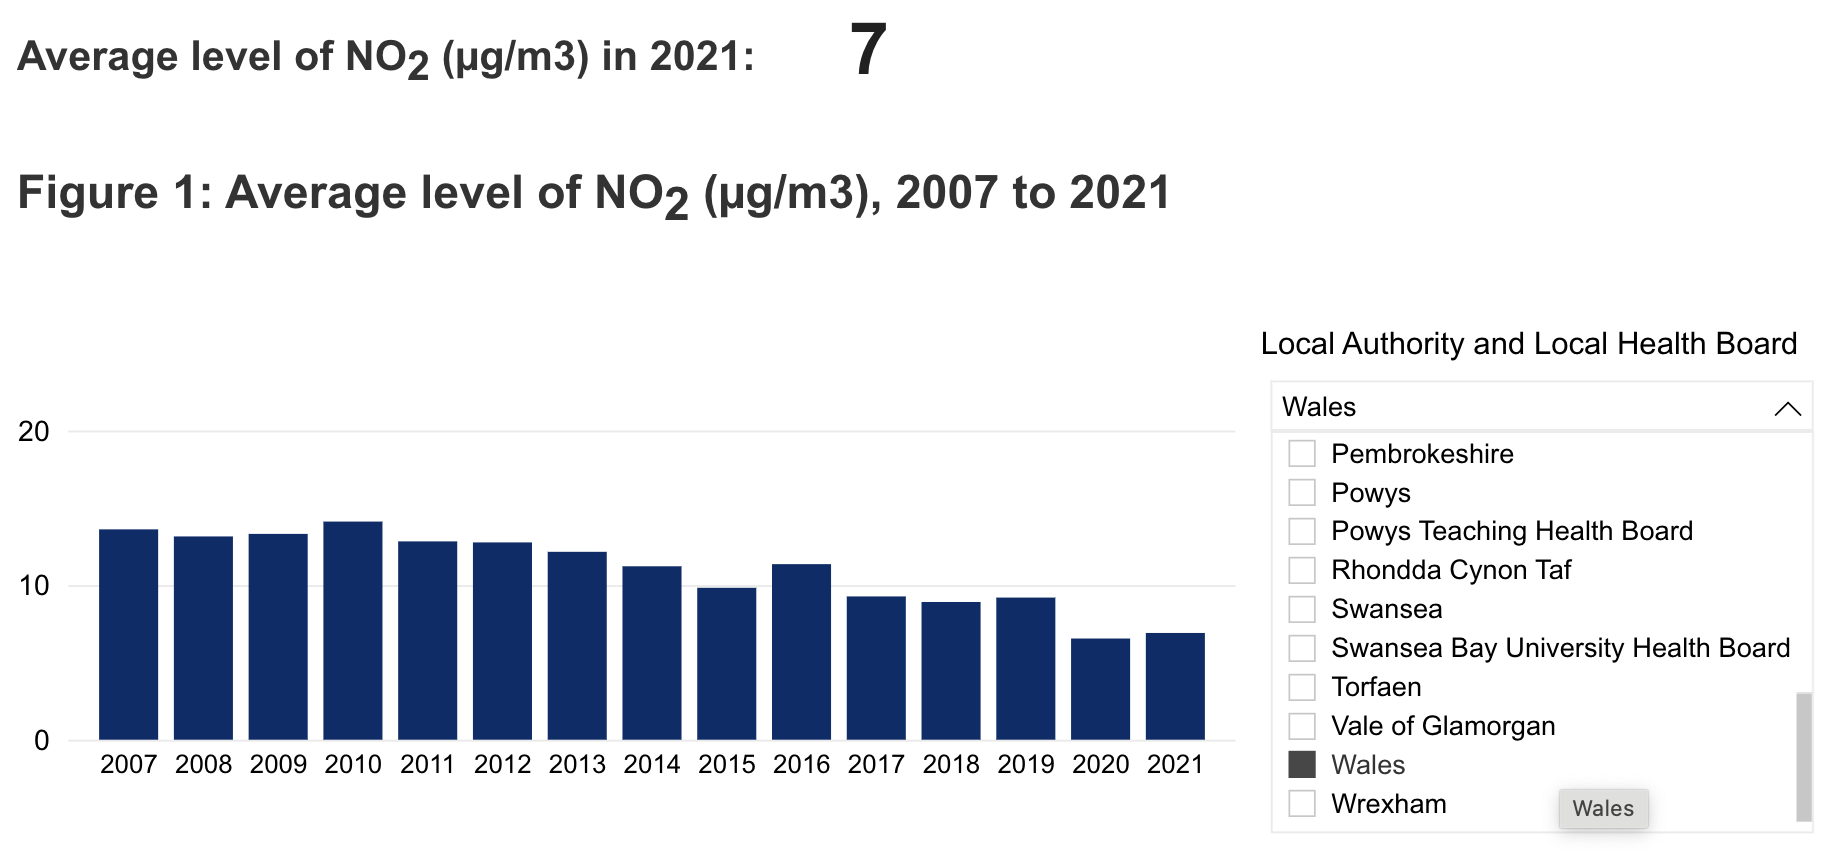
Average level of NO2 (μg/m3) in 2021: 7
2021年のNO2(μg/m3)の平均レベル: 7
Figure 1: Average level of NO2 (μg/m3), 2007 to 2021
図1:2007年から2021年のNO2(μg/m3)の平均レベル
Description of figure 1:
The bar chart shows that overall, the average concentration levels of NO2 to which people are exposed have been declining over the past decade.
図1の説明:
バーチャートは、全体として、人々が暴露されるNO2の平均濃度レベルが過去10年間で減少していることを示しています。
What does the data say?
The national indicator on NO2 emissions shows that overall, the average concentration levels to which people are exposed have been declining over the past decade. After a period of relative stability between 2017 and 2019 (at around 9 μg/m3), the average concentration decreased to 7 μg/m3 in 2020 and remained at 7 μg/m3 in 2021. The highest concentrations of nitrogen dioxide emissions are found in urban areas and near busy roads, reflecting the contribution of traffic and urban activities to poor air quality.
データは何を示していますか?
NO2排出の全国指標は、全体として、人々が暴露される平均濃度レベルが過去10年間で減少していることを示しています。2017年から2019年の間に相対的に安定していた(約9 μg/m3)の後、2020年には平均濃度が7 μg/m3に減少し、2021年も7 μg/m3のままでした。二酸化窒素排出の最高濃度は都市部および交通量の多い道路付近で見られ、交通と都市活動が大気汚染に寄与していることを反映しています。
Contact email: stats.environment@gov.wales
Last update:July 2022
Next update: November 2023 (provisional)
Source 1: Air Concentration, Department for Environment, Food and Rural Affairs
Source 2: Small area population estimates (SAPE), Office for National Statistics
External links to: data and other pollutants: [raw data](https://gov.wales/raw-data) and [maps](https://gov.wales/maps); indicator [data set](https://gov.wales/data-set); Further context: information and maps relating to [air quality in Wales](https://gov.wales/air-quality).
Designation:The source of this indicator is not published as an official statistic.
連絡先メール: stats.environment@gov.wales
最終更新日: 2023年9月
次回更新予定日: 2024年9月
出典: National Community Child Health Database (NCCHD)
リリース: 出産および出生統計
指定: National Statistics
外部リンク:
.