


Percentage of children who have two or more healthy behaviours
What is the Indicator?
Percentage of children (aged 11 to 16) who have two or more healthy lifestyle behaviours. The healthy lifestyle behaviours include:
- not smoking;
- never/rarely drinking alcohol;
- eating fruit or vegetables every day;
- being physically active for an hour or more, 7 days a week.
この指標について
2つ以上の健康的なライフスタイル行動を持つ子供(11歳から16歳)の割合。健康的なライフスタイル行動には以下が含まれます:
- 喫煙しない;
- 酒を飲まない、またはめったに飲まない;
- 毎日果物や野菜を食べる;
- 週に7日、1時間以上身体を動かす。
What is the milestone?
To increase the percentage of children with two or more healthy behaviours to 94% by 2035 and more than 99% by 2050.
目標は何ですか?
2035年までに2つ以上の健康行動を持つ子供の割合を94%に、2050年までに99%以上に増やすことです。
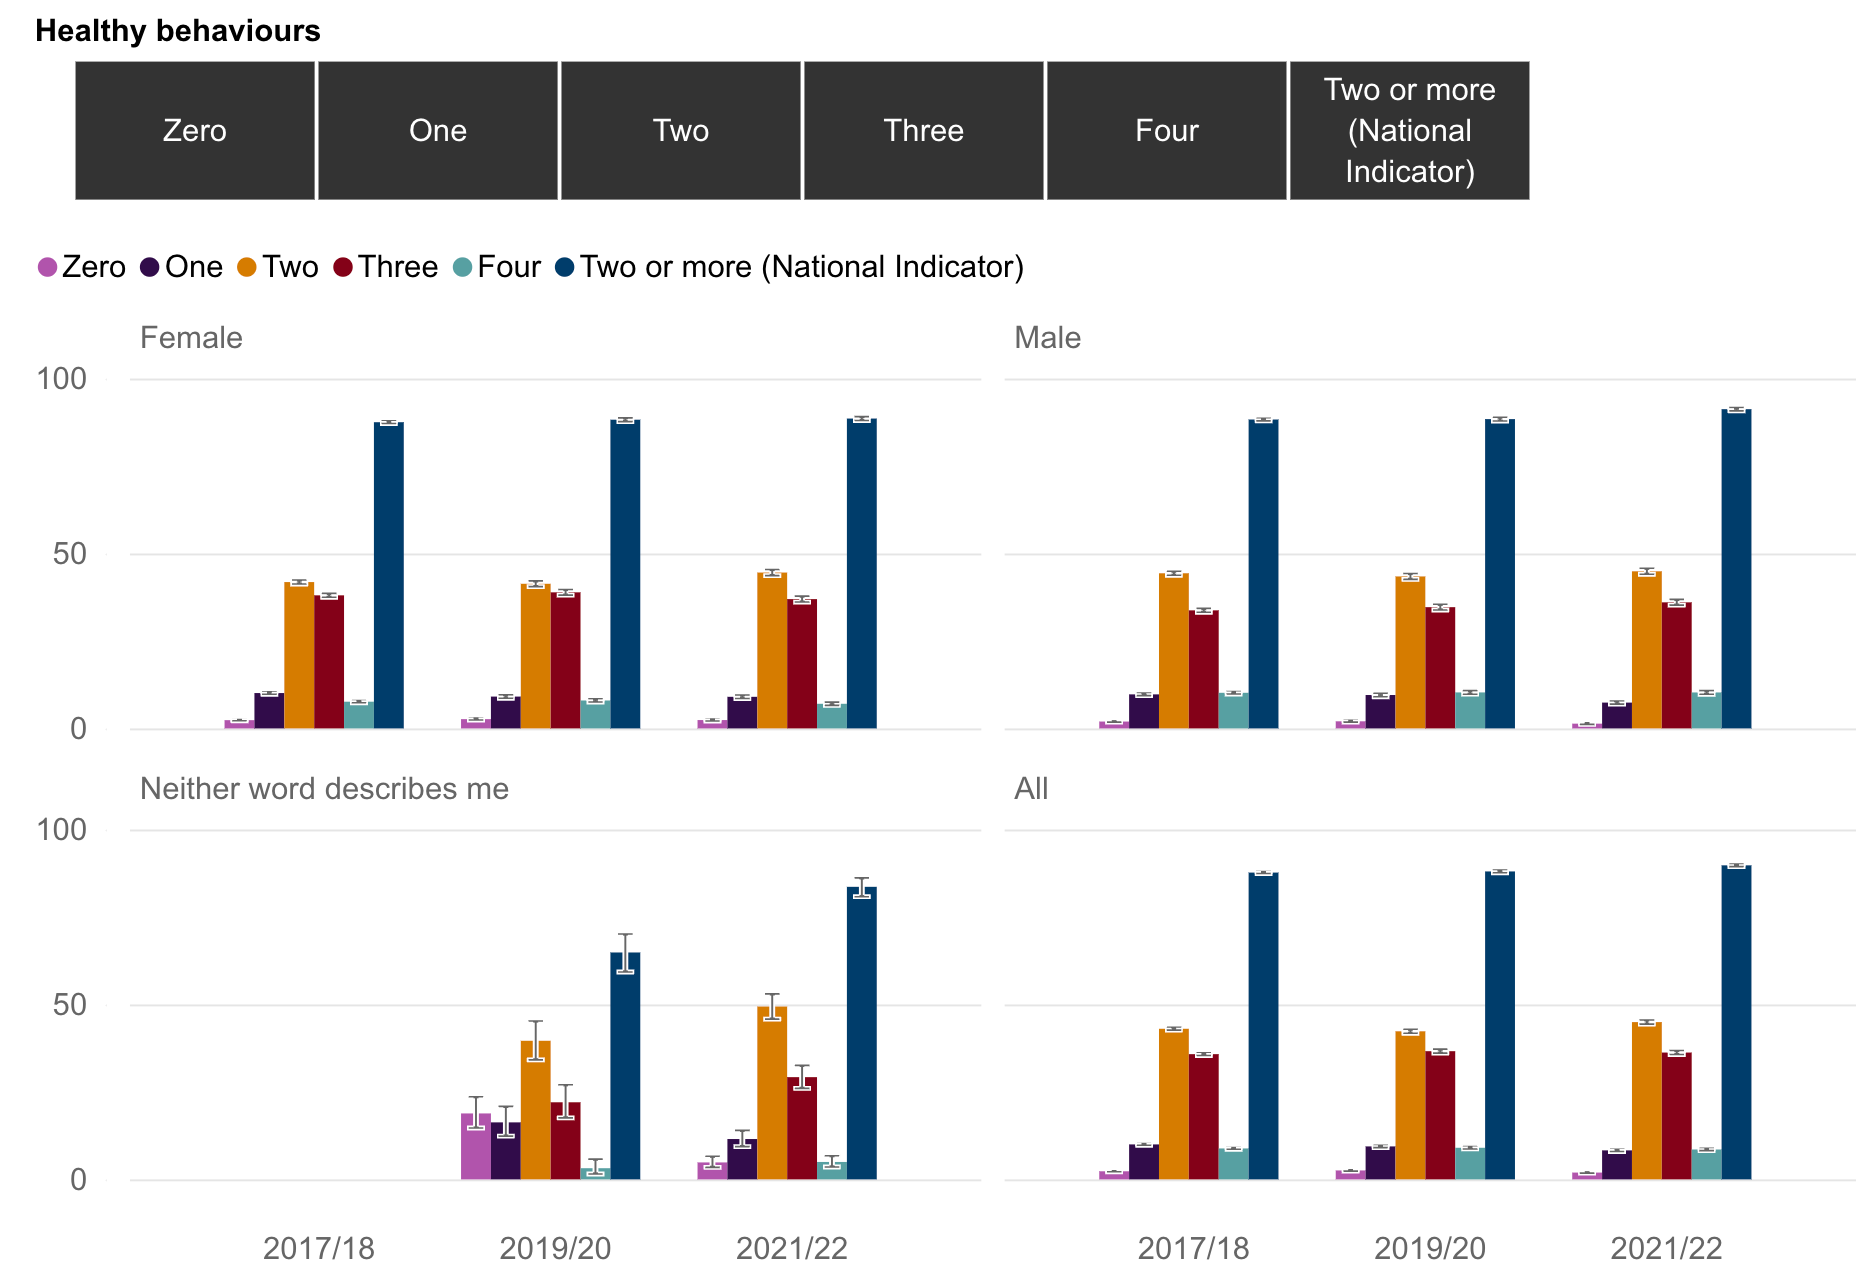
Figure 1: Percentage of children aged 11 to 16 by number of healthy lifestyle behaviours and gender
図1:性別ごとの11歳から16歳の子供の健康行動の数に基づく割合
Description of figure 1:
Filterable bar charts showing that the percentage of young people aged 11 to 16 with two or more healthy behaviours has increased slightly over the course of the time series. An additional gender category was introduced in the 2019/20 academic year for those who identified as neither a boy nor a girl. In the latest data, boys had a higher percentage of two or more healthy lifestyle behaviours than girls and those who identified as neither a boy nor a girl. The error bars represent the upper and lower confidence levels.
図1の説明:
フィルタ可能な棒グラフは、11歳から16歳の若者のうち、2つ以上の健康行動を持つ割合が時間の経過とともにわずかに増加していることを示しています。2019/20学年度には、男の子でも女の子でもないと認識する人々のための追加の性別カテゴリが導入されました。最新のデータでは、男の子が女の子や男の子でも女の子でもないと認識する人々よりも2つ以上の健康的なライフスタイル行動を持つ割合が高かったです。誤差棒は上限および下限の信頼区間を示しています。
Figure 2: Percentage of children aged 11 to 16 who have two or more healthy lifestyle behaviours by age and gender
図2:年齢および性別ごとの2つ以上の健康的なライフスタイル行動を持つ11歳から16歳の子供の割合
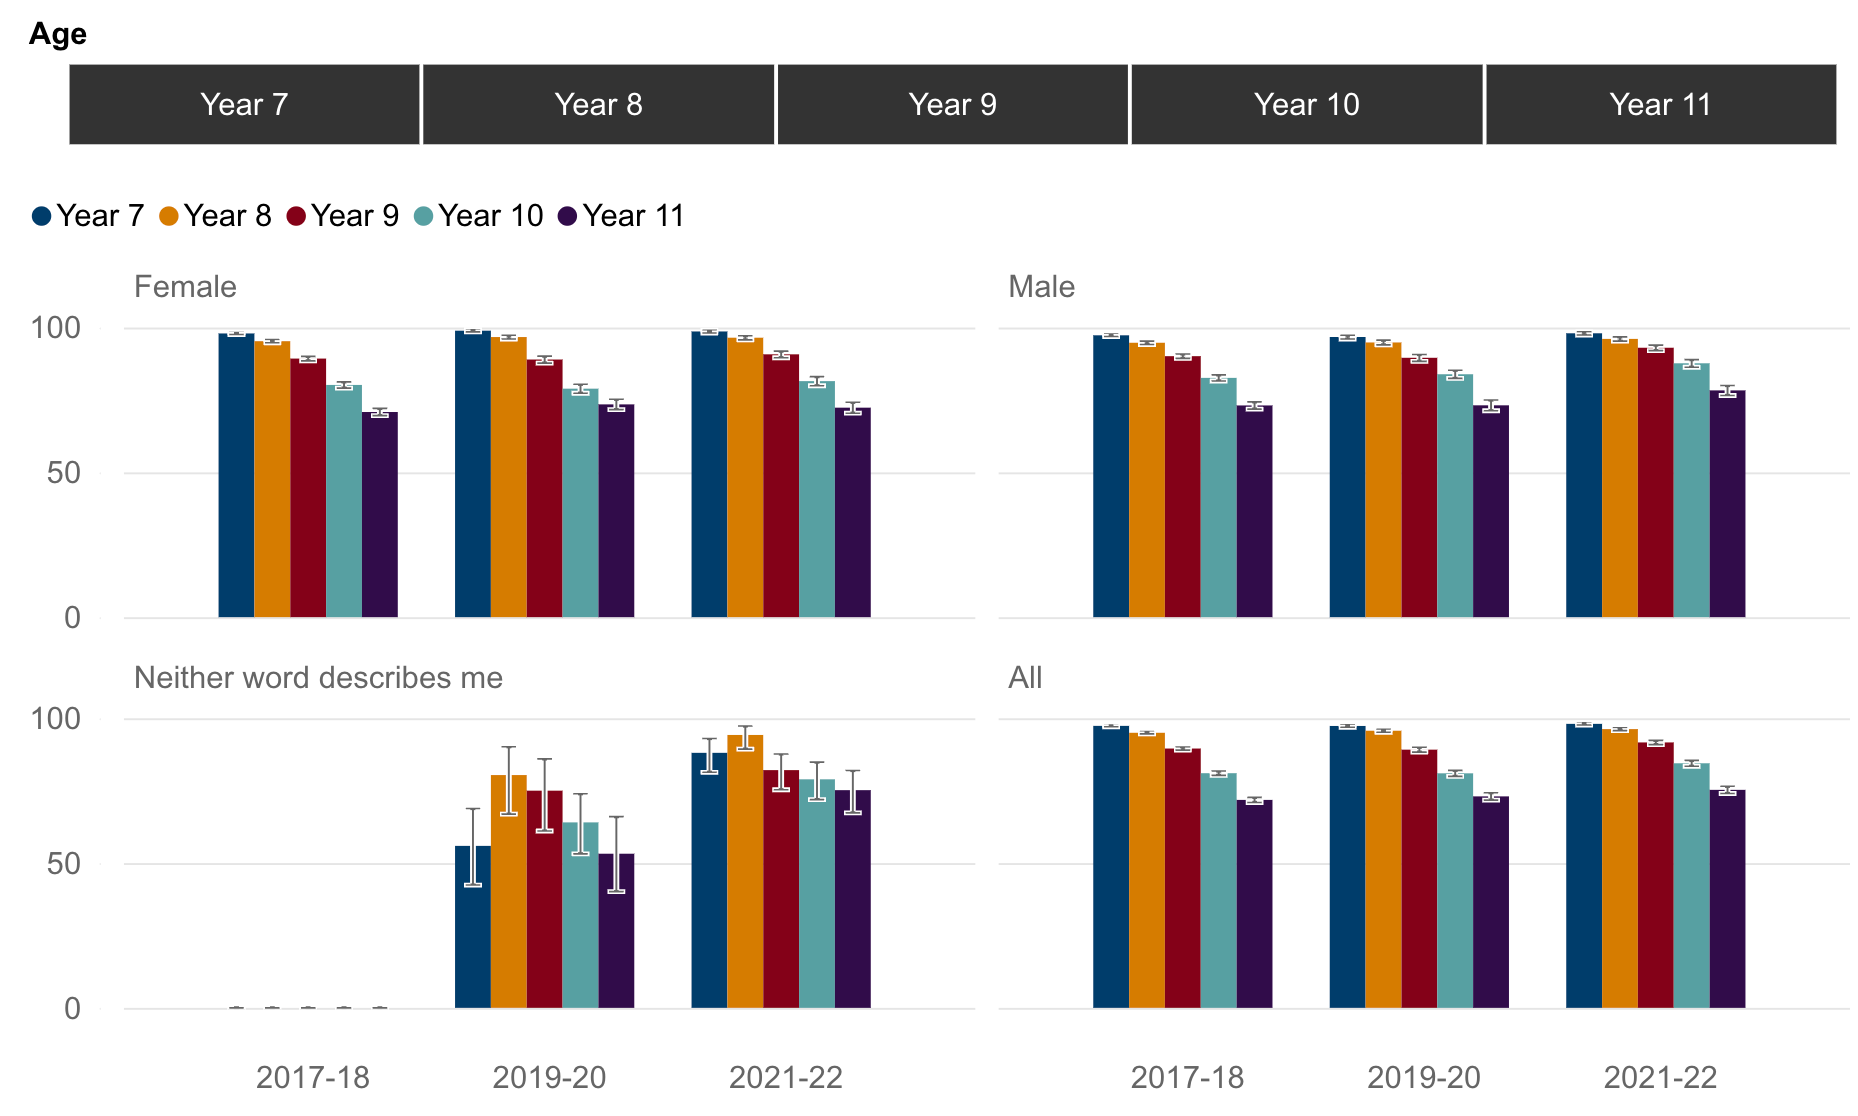
Description of figure 2:
Filterable bar charts showing that the percentage of young people aged 11 to 16 with two or more healthy behaviours declines with age for boys and girls. An additional gender category was introduced in the 2019/20 academic year for those who identified as neither a boy nor a girl. The latest data shows a greater decline in healthy behaviours with age for boys compared to girls. The error bars represent the upper and lower confidence levels.
図2の説明:
フィルタ可能な棒グラフは、11歳から16歳の若者のうち、2つ以上の健康行動を持つ割合が年齢とともに減少していることを示しています。2019/20学年度には、男の子でも女の子でもないと認識する人々のための追加の性別カテゴリが導入されました。最新のデータでは、男の子に比べて女の子の年齢とともに健康行動の減少が大きいことを示しています。誤差棒は上限および下限の信頼区間を示しています。
Figure 3: Percentage of children aged 11 to 16 who have two or more healthy lifestyle behaviours by ethnicity
図3:民族別の2つ以上の健康的なライフスタイル行動を持つ11歳から16歳の子供の割合
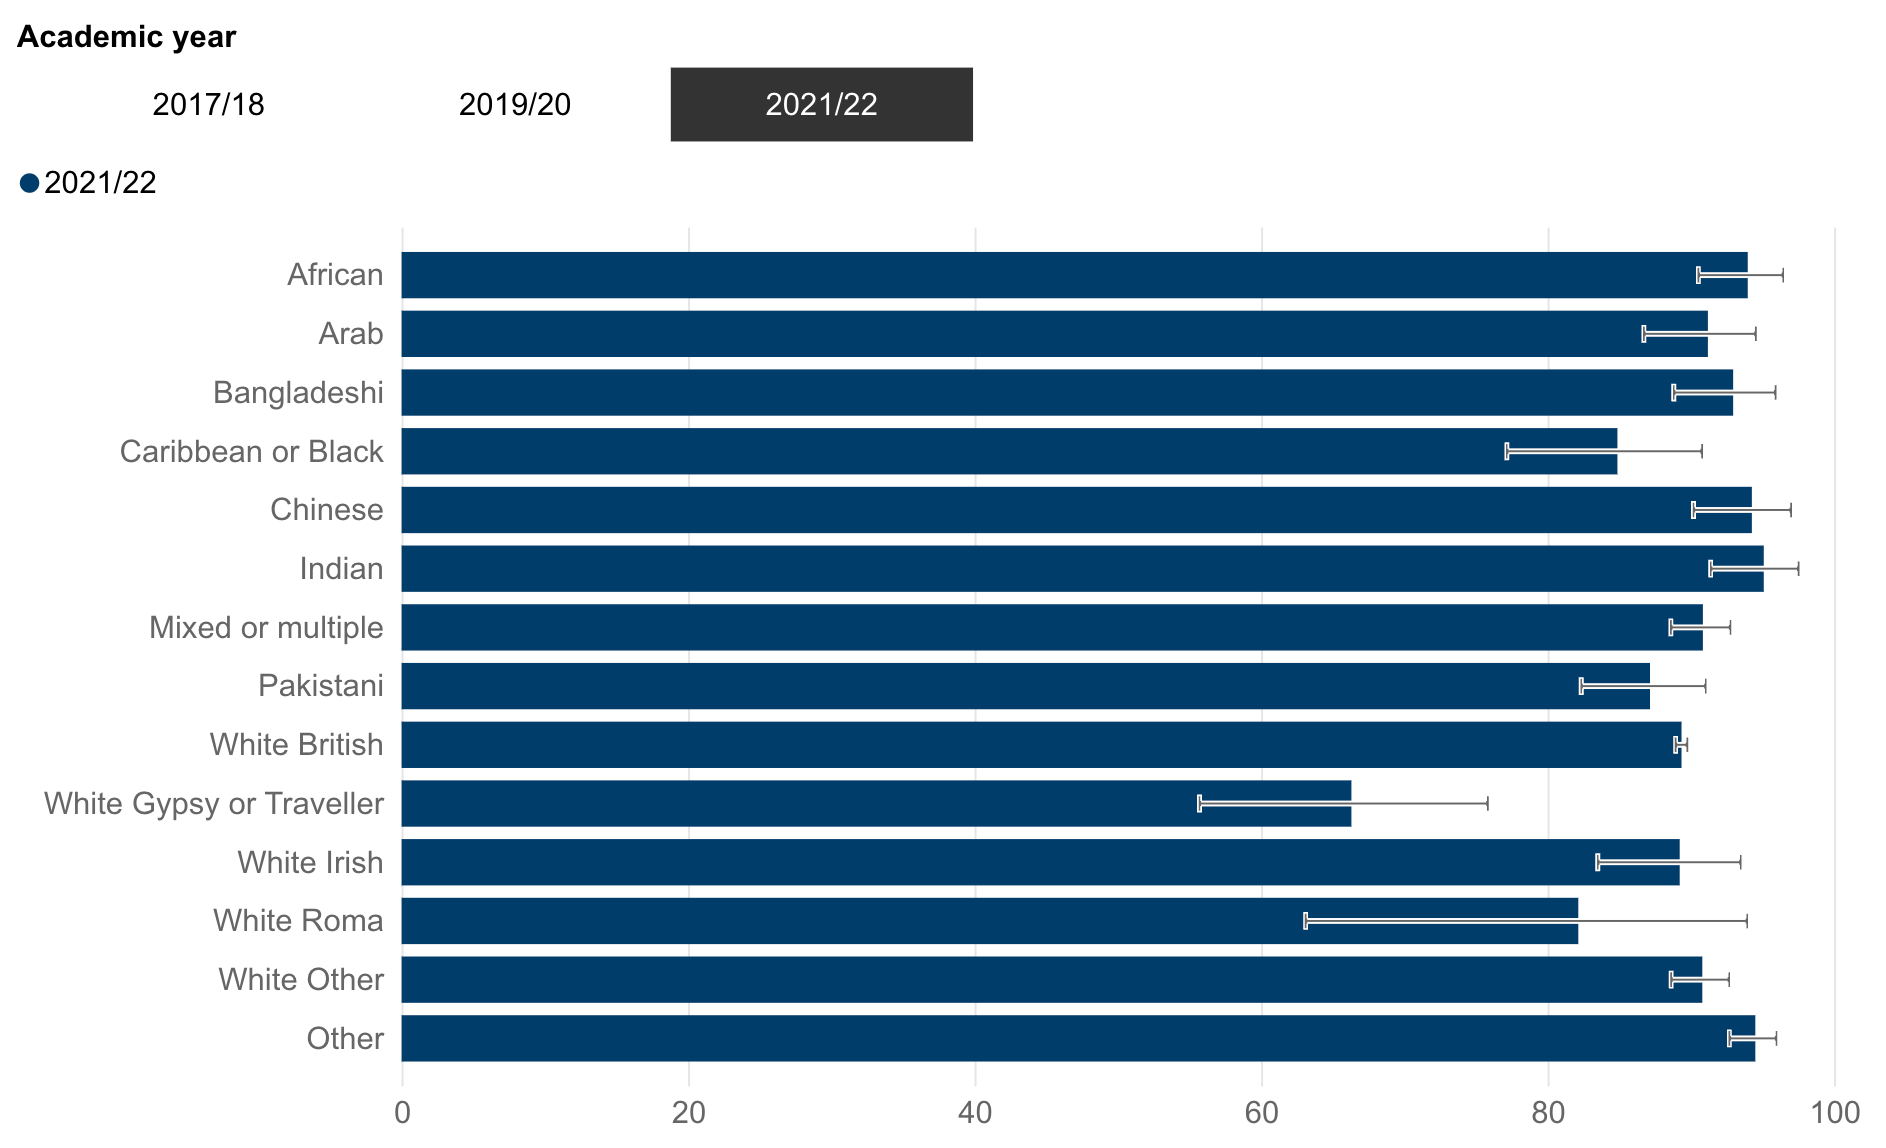
Description of figure 3 :
Filterable bar chart showing variation by ethnic group in the percentage of young people aged 11 to 16 with two or more healthy behaviours. The latest data shows the percentage with two healthy behaviours is lowest in the 'White Gypsy or Irish Traveller' group. From the 2021/22 academic year, the 'White Gypsy or Traveller' category was split into 'White Gypsy or Irish Traveller' and 'White Roma'. Some sample sizes remain small, including for 'White Roma' in particular. The error bars represent the upper and lower confidence levels.
図3の説明:
フィルタ可能な棒グラフは、11歳から16歳の若者のうち、2つ以上の健康行動を持つ割合の民族グループ別の変動を示しています。最新のデータでは、「白人ジプシーまたはアイリッシュトラベラー」グループで2つの健康行動の割合が最も低いことを示しています。2021/22学年度から、「白人ジプシーまたはトラベラー」カテゴリは「白人ジプシーまたはアイリッシュトラベラー」と「白人ローマ」に分割されました。いくつかのサンプルサイズは依然として小さく、特に「白人ローマ」に関してはそうです。誤差棒は上限および下限の信頼区間を示しています。
Figure 4: Percentage of children aged 11 to 16 who have two or more healthy lifestyle behaviours by family affluence
図4:家庭の裕福さ別の2つ以上の健康的なライフスタイル行動を持つ11歳から16歳の子供の割合
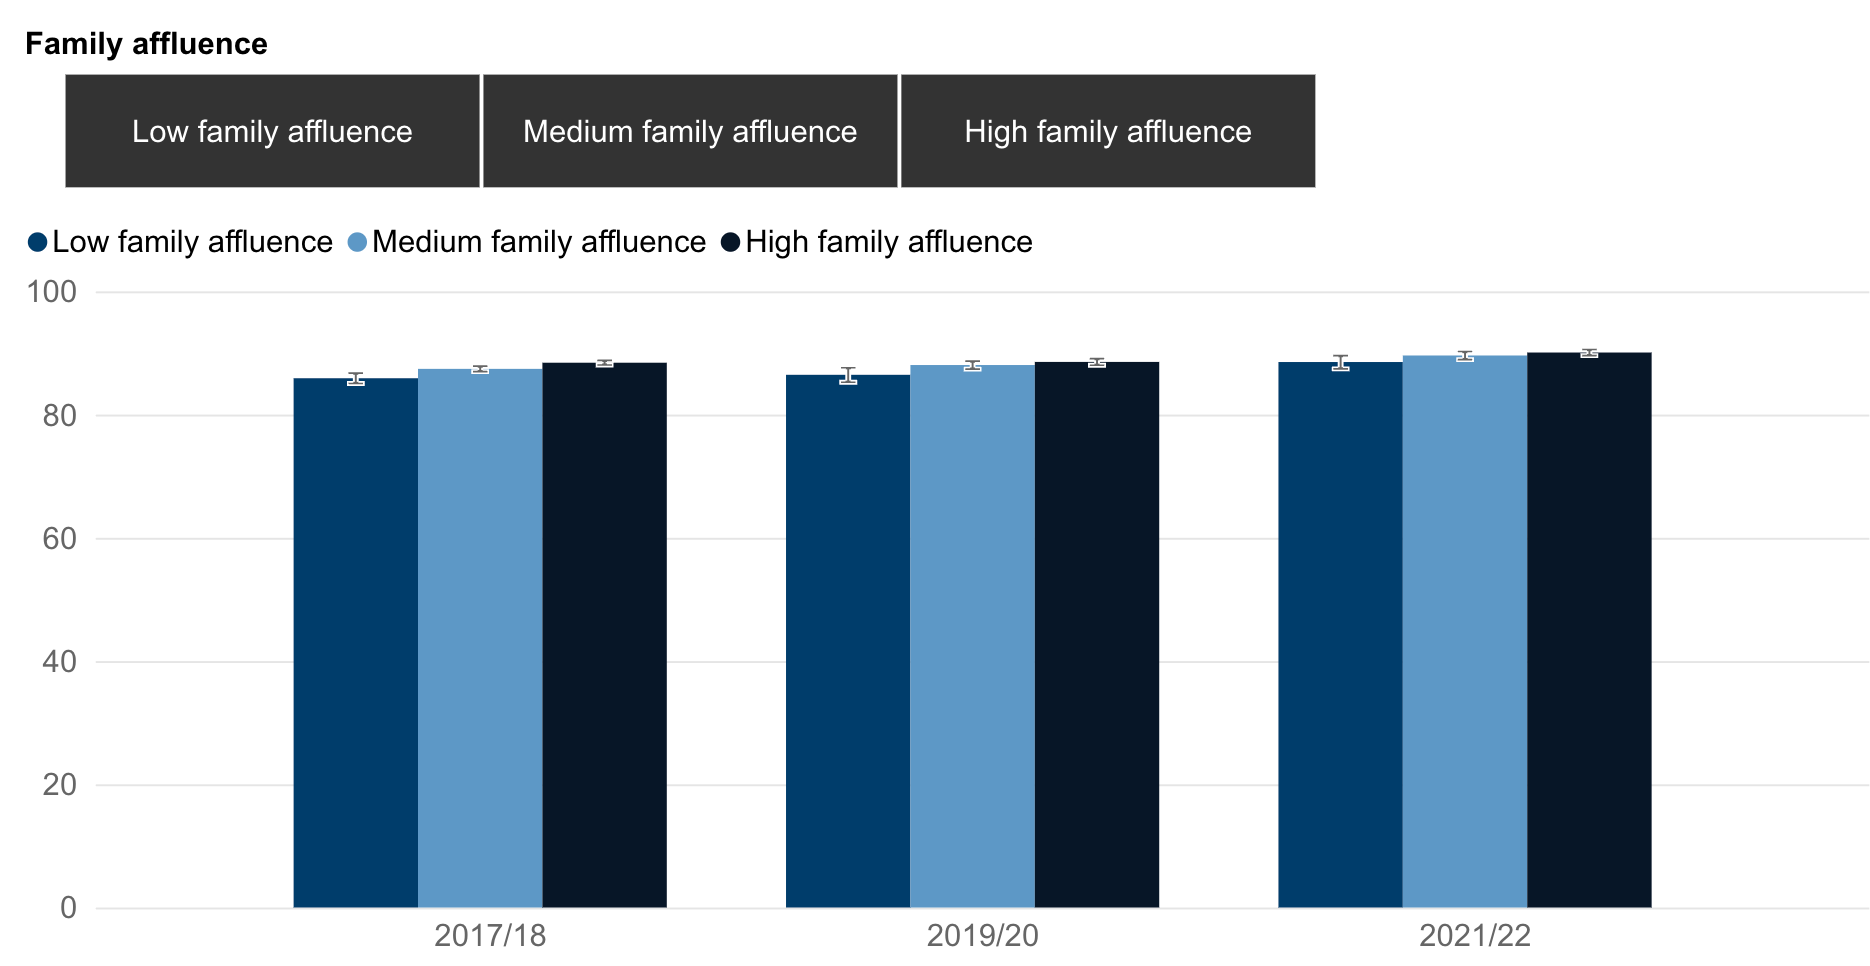
Description of figure 4 :
Filterable bar charts showing the percentage of young people aged 11 to 16 with two or more healthy behaviours across three family affluence groups. In the latest data, there was little difference by family affluence. Typically, the total family affluence scale (FAS) score is calculated for each student who responds to six questions on bedroom occupancy, car, computer, and dishwasher ownership, number of household bathrooms; and family holidays. However, the question on family holidays was excluded from calculations in 2021/22 due to concerns around comparability with previous years as a result of the COVID-19 imposed travel restrictions. The error bars represent the upper and lower confidence levels.
図4の説明:
フィルタ可能な棒グラフは、家庭の裕福さによって3つのカテゴリーに分けた11歳から16歳の若者のうち、2つ以上の健康行動を持つ割合を示しています。最新のデータでは、家庭の裕福さによる差はほとんどありませんでした。通常、総合家庭裕福度(FAS)スコアは、寝室の占有、車、コンピュータ、食器洗い機の所有、家庭のバスルームの数、家族旅行についての6つの質問に答えた各学生に対して計算されます。ただし、2021/22年にはCOVID-19による旅行制限のため、家族旅行に関する質問は計算から除外されました。誤差棒は上限および下限の信頼区間を示しています。
What does the data say?
Details of the individual lifestyle behaviours can be found at the external links.
In the 2021/22 academic year, the percentage of young people aged 11 to 16 with two or more healthy behaviours was 90%, compared to 88% in the 2019/20 academic year.
データは何を示していますか?
個々のライフスタイル行動の詳細は、外部リンクで確認できます。
2021/22学年度では、11歳から16歳の若者のうち、2つ以上の健康行
動を持つ割合は90%であり、2019/20学年度の88%と比較して増加しています。
Contact email: stats.healthinfo@gov.wales
Last update: September 2023
Next update: July 2025
Source: School Health Research Network (SHRN)
Title: Student Health and Wellbeing Survey
Note: The source of this indicator is the 2021/22 SHRN Student Health and Wellbeing Survey.
External links:
- School Health Research Network (SHRN)
- Student Health and Wellbeing In Wales: Report of the 2021/22 SHRN Student Health and Wellbeing Survey
- SHRN Data dashboard - Public Health Wales
連絡先メール:stats.healthinfo@gov.wales
最終更新日: 2023年9月
次回更新日: 2025年7月
出典: School Health Research Network (SHRN)
タイトル: Student Health and Wellbeing Survey
注: この指標の出典は2021/22 SHRN Student Health and Wellbeing Surveyです。
外部リンク:
- School Health Research Network (SHRN)
- Student Health and Wellbeing In Wales: Report of the 2021/22 SHRN Student Health and Wellbeing Survey
- SHRN Data dashboard - Public Health Wales
.