


Healthy life expectancy at birth including the gap between least and most deprived
What is the Indicator?
この指標について
Healthy life expectancy at birth, plus the gap in years between the most and least deprived areas. The gap is measured using the absolute difference between the least and the most deprived fifths, which simply subtracts the most deprived fifth from the least deprived fifth for a particular area. It is also referred to as the range.
Life expectancy is a widely used statistical measure of the average expected years of life for a new born based on recently observed mortality rates. Healthy life expectancy represents the number of years a person might expect to live in good health. Estimates can vary depending on the methods and sources used. 3-year averages are shown here.
出生時の健康寿命、および最も恵まれない地域と最も恵まれた地域の間の年数の差です。この差は、特定の地域の最も恵まれた五分位と最も恵まれない五分位の絶対差を使用して測定されます。これは範囲とも呼ばれます。
平均余命は、新生児が最近観察された死亡率に基づいて期待される平均生存年数の広く使用されている統計的尺度です。健康寿命は、人が健康に生きることが期待される年数を表します。推定値は、使用される方法やソースによって異なる場合があります。ここでは3年平均を示しています。
What is the milestone?
To increase the healthy life expectancy of adults and narrow the gap in healthy life expectancy between the least and the most deprived areas by at least 15% by 2050.
マイルストーンは何ですか?
2050年までに成人の健康寿命を延ばし、最も恵まれない地域と最も恵まれた地域の健康寿命の格差を少なくとも15%縮小すること。
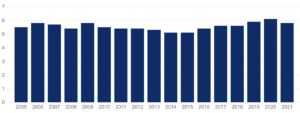
Trends in healthy life expectancy from 2011-13 to 2018-20:
2011-13年から2018-20年の健康寿命の傾向:
Figure 1: Healthy Life Expectancy (Years)
図1:健康寿命(年)
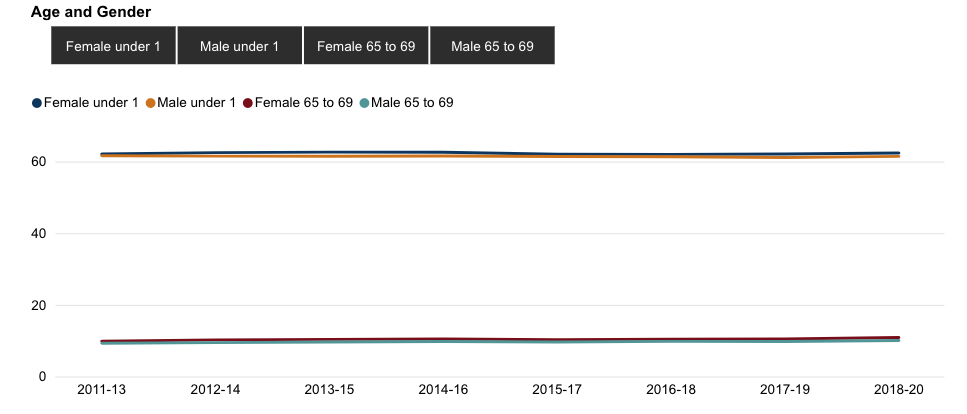
Figure 2: Gap in Healthy Life Expectancy(Years)between the most and least depprived areas
図2:最も恵まれた地域と最も恵まれない地域の間の健康寿命の格差(年)

Description of figure 2:
A filterable line chart showing that the gap in healthy life expectancy has remained wide but relatively stable between 2011-2013 and 2016-2018 for males and females. In 2018-20, the gap in females was over three and a half years larger than for males. The shaded areas within this chart around each line, represent the upper and lower confidence levels.
図2の説明:
フィルタリング可能な折れ線グラフは、健康寿命の格差が広がりつつも、2011-2013年と2016-2018年の間で男性と女性で比較的安定していることを示しています。2018-20年では、女性の格差が男性よりも3年半以上大きいです。このグラフ内の各線の周囲にある陰影部分は、上限および下限の信頼区間を表しています。
Table 1: Gap in Healthy Life Expectancy (Years) between the most and least deprived areas in 2018-20
表1:2018-20年の最も恵まれた地域と最も恵まれない地域の間の健康寿命の格差(年)
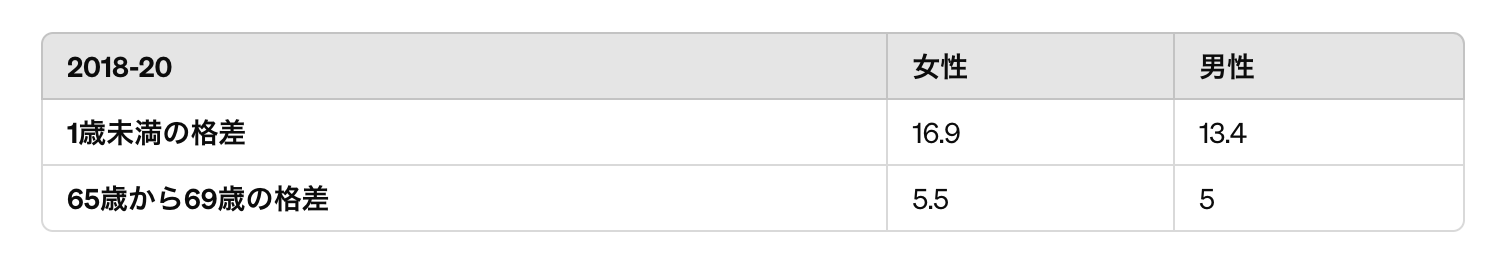
Description of table:
A table showing that in 2018-20, the gap in females aged under 1 was over three and a half years larger than for males aged under 1. This same gap is not observed in the aged 65 to 69 group.
表の説明
2018-20年では、1歳未満の女性の格差が1歳未満の男性の格差よりも3年半以上大きいことを示しています。この同じ格差は、65歳から69歳のグループでは観察されません。
What does the data say?
The gap in healthy life expectancy between the most and least deprived areas has remained wide but relatively stable between 2011-2013 and 2016-2018 for males and females. In 2018-20, the gap in females was over three and a half years larger than for males.
データは何を示していますか?
最も恵まれた地域と最も恵まれない地域の間の健康寿命の格差は広がりつつも、2011-2013年と2016-2018年の間で男性と女性で比較的安定していました。2018-20年では、女性の格差が男性よりも3年半以上大きいです。
Contact email: stats.healthinfo@gov.wales
Last update: June 2023
Next Update: June 2024
Source: Office for National Statistics
Designation: National Statistics
External links:
- Health expectancies in Wales with inequality gap profile - Public Health Wales
- Health expectancies in Wales with inequality gap - Public Health Wales
- Public Health Outcomes Framework - Public Health Wales
Releases:
元投稿リンク:https://www.gov.wales/wellbeing-wales-national-indicators
02:Healthy life expectancy at birth including the gap between least and most deprived
.